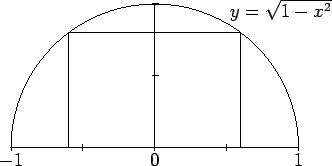
Figure 2.1 is created from the commented source file semicirc.xp:
#include "epix.h"
using namespace ePiX;                   // similar to \usepackage

// "double" = double-precision floating point
double f(double x) { return sqrt(1-x*x); } // i.e., f(x) = \sqrt{1-x^2}

double width = 0.6, height = f(width);  // rectangle dimensions
P label_here(0.5, f(0.5));              // position of graph label

int main()
{
  unitlength("1in");
  picture(2.5, 1.25);                   // set printed size, 2.5 x 1.25in
  bounding_box(P(-1, 0), P(1, 1));      // corners; depict [-1,1] x [0,1]

  begin();   // ----- figure body starts here -----
  h_axis(4);                            // mark off 4 intervals, etc.
  v_axis(2);
  // 2 label intervals; shift down 4pt, place below Cartesian location
  h_axis_labels(2, P(0, -4), b);

  arc(P(0,0), 1, 0, M_PI);              // center, radius, start/end angle
  bold();                               // paths only, not fonts
  rect(P(-width,0), P(width, height));  // rectangle given by corners

  // shift label right 2pt, up 4pt, align on reference point (default)
  label(label_here, P(2,4), "$y=\\sqrt{1-x^2}$");
  end();
}
ePiX commands are of three types: definitions (of data and
functions), attribute setting, and drawing. Like a LATEX document,
an ePiX file contains a preamble, which specifies aspects of
the figure's appearance, and a body, which contains the actual
figure-generating commands.
Variables have been used to give logical structure to the figure: The width of the rectangle and the the location of the label are localized to two lines in the preamble, and the rectangle's height is computed from the width. The capacity to structure figures logically is one of ePiX's strengths. In a file as short as this, hard-wired constants are adequate, but the importance of structuring increases rapidly with the size of the input file, and good habits are best formed from the start. The function definition is mostly for illustration, though does provide slightly better organization than
double width = 0.6, height = sqrt(1-width*width);
double lab_x = 0.5;
P label_here(lab_x, sqrt(1-lab_x*lab_x));