Mathematics 300 -- Reading Course in Real Analysis
April 16, 1999
A Convolution Example --
We let
f(x) = 1
if
![]() ,
,
0 if
![]()
(a "boxcar" function) and
g(x)
be the Gaussian:
![[Maple Math]](images/Convo3.gif) . The convolution
f * g
is
. The convolution
f * g
is
the function (
f * g)(x) =
![[Maple Math]](images/Convo4.gif) =
=
![[Maple Math]](images/Convo5.gif) , or as a Maple function:
, or as a Maple function:
> conv:=x->evalf(int((10/sqrt(Pi))*exp(-100*(x-y)^2),y=-1..1));
![[Maple Math]](images/Convo6.gif)
Here's the plot of the convolution function:
> plot(conv(x),x=-2..2);
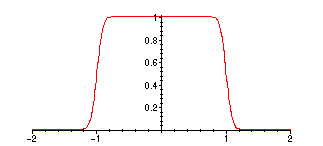
Note that this essentially looks like a "smeared-out" version of the boxcar function f, with the
discontinuities removed. (In fact, this function is infinitely differentiable!)
For each fixed x, we can visualize the value of ( f * g)(x) like this: the graph of g(x - y) is a shifted
and reflected copy of the graph of g(y). Hence the integral of f(y)g(x - y) is (for this f) the portion
the area under the graph of g(x - y) that lies between y = -1 and y = 1. CAUTION: you want
to think of BOTH x and y as horizontal axes here.
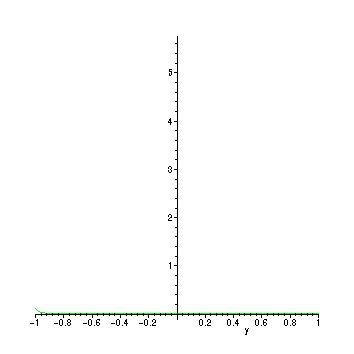
> g:=x->10*exp(-100*x^2)/sqrt(Pi);
![[Maple Math]](images/Convo8.gif)
> with(plots):
> animate(g(x-y),y=-1..1,x=-1.2..1.2,numpoints=100,frames=50);
At the x-value represented by the peak (max) of the blue curve as it moves, the convolution
is equal to the area under the curve between -1 and 1.
>