MATH 375 -- Probability Theory 

The Correlation Coefficient and Its Geometric Meaning
November 16, 2011


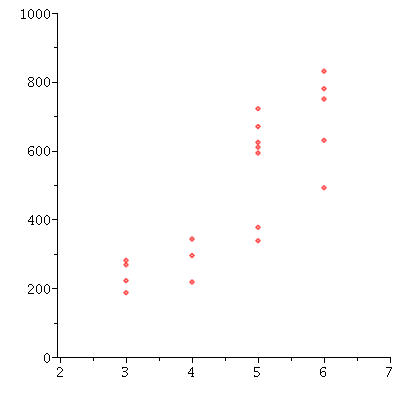
The following plot shows points x, ywhere   


    x = age in years 

    y = weight in grams 


for a collection of smallmouth bass taken in a stream 

in Washington State:  


> `assign`(BassData, [[3, 187], [3, 222], [4, 218], [3, 268], [3, 281], [4, 343], [5, 338], [4, 295], [5, 377], [6, 492], [5, 624], [5, 593], [5, 610], [6, 630], [5, 670], [6, 750], [5, 722], [6, 780], ...
`assign`(BassData, [[3, 187], [3, 222], [4, 218], [3, 268], [3, 281], [4, 343], [5, 338], [4, 295], [5, 377], [6, 492], [5, 624], [5, 593], [5, 610], [6, 630], [5, 670], [6, 750], [5, 722], [6, 780], ...


> plot(BassData, style = point, view = [2 .. 7, 0 .. 1000]); 1
 

Plot_2d


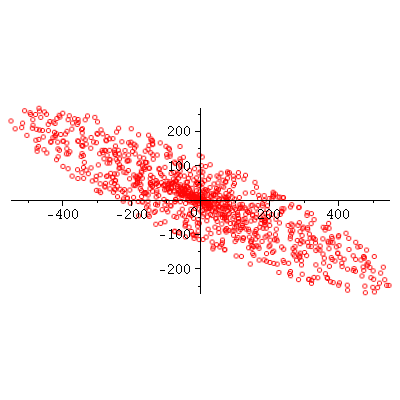
Given a scatter plot, the correlation coefficient  r 

is a way to quantify how close the points (x, y) are to 

lying along a single straight line.  The coefficient
takes values in the range  -1to 1:


A value of r = -1:  indicates that the points all
                             lie along a line of negative slope

                 
r = 0:    indicates no linear relationship at all

                 
r = +1:  indicates that the points all
                              lie along a line of positive slope

Values between 0 and 1 or between -1 and 0  indicate
 

the ``strength'' of the tendency toward a linear relation
between  
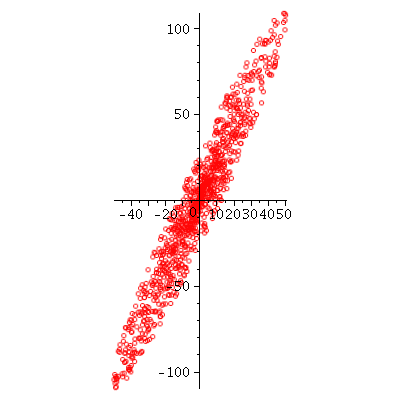
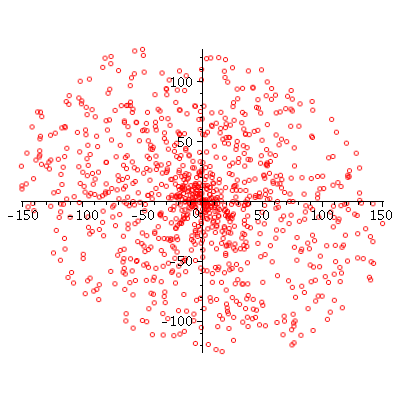
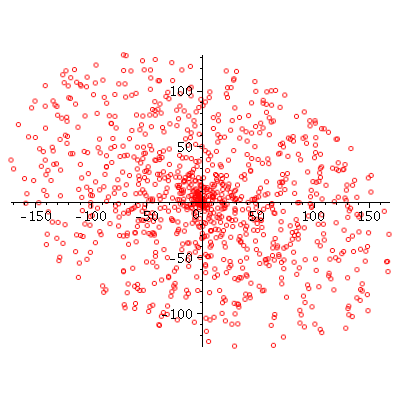
x  and  y.  Here are some illustrative examples:     

> with(Statistics); -1
 

> Correlation(`<,>`(seq(BassData[i][1], i = 1 .. nops(BassData))), `<,>`(seq(BassData[i][2], i = 1 .. nops(BassData)))); 1
Correlation(`<,>`(seq(BassData[i][1], i = 1 .. nops(BassData))), `<,>`(seq(BassData[i][2], i = 1 .. nops(BassData)))); 1
 

.8402188205 (1)
 

> randomize(); 1
 

1320928669 (2)
 

`assign`(r1, `+`(`*`(`/`(1, 10000000), `*`(rand(1 .. 100000000))))); -1 

`assign`(CloudPlot, proc (a, b, p) local xs, ys, i, theta, s, C; `assign`(xs, []); `assign`(ys, []); for i to 1000 do `assign`(theta, evalf(`+`(`*`(2, `*`(Pi, `*`(r1())))))); `assign`(s, r1()); `assig...
 

CloudPlot(5, 11, .9); 1 


Correlation coefficient is r =
Plot_2d
 

CloudPlot(5, 11, .7); 1 


Correlation coefficient is r =
Plot_2d
 

CloudPlot(5, 11, .5); 1 


Correlation coefficient is r =
Plot_2d
 

CloudPlot(5, 11, .3); 1 


Correlation coefficient is r =
Plot_2d
 

CloudPlot(5, 11, .1); 1 


Correlation coefficient is r =
Plot_2d
 

CloudPlot(5, 11, -.1); 1 


Correlation coefficient is r =
Plot_2d
 

CloudPlot(5, 11, -.3); 1 


Correlation coefficient is r =
Plot_2d
 

CloudPlot(5, 11, -.5); 1 


Correlation coefficient is r =
Plot_2d
 

CloudPlot(5, 11, -4); 1 


Correlation coefficient is r =
Plot_2d