MATH 375 -- Probability and Statistics 1
Central Limit Theorem Demonstration
December 1, 2009
We consider the distribution of the means of
random samples of size n from a given distribution,
described by a given pdf 
| > |
 |
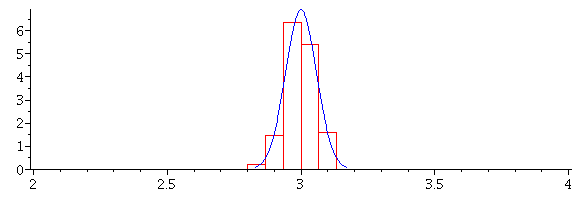
First, let's consider a uniform distribution on the interval from 2 to 4, and  The procedure MP
takes 300 random samples of size 100 from this distribution and plots a histogram of the means.
| > |
 |
 |
(1) |
| > |
 |
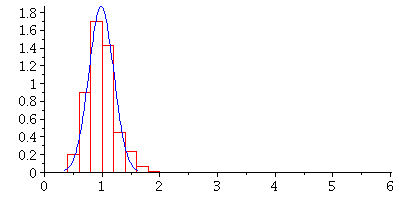
Second, let's do the same sort of experiment with an exponential distribution.
| > |
 |
 |
(2) |
| > |
 |
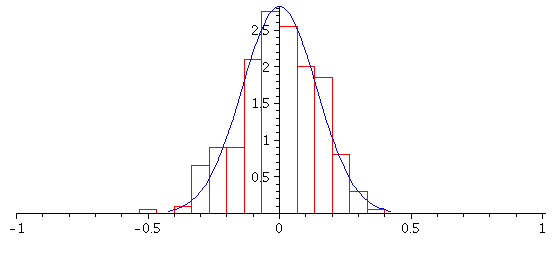
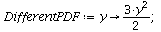
Next let's take a rather different-looking pdf:
| > |
 |
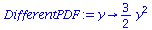 |
(3) |
| > |
 |
 |
(4) |
Again, we take random samples of size n from this distribution and
plot a histogram of their means. As n increases, note how the distribution
of the sample means becomes closer and closer to a normal(!)
| > |
 |
 |
(5) |
| > |
 |
 |
(6) |