MATH 376 -- Probability and Statistics 2
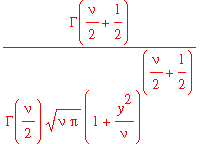
Student's t -distribution
January 23, 2004
| > | read "/home/fac/little/public_html/ProbStat/MaplePackage/MSP.map"; |
![]()
The following gives the form of the
t
-distribution pdf with
![]() degrees of freedom:
degrees of freedom:
| > | TPDF(nu,y); |

| > | TP:=plot([y->TPDF(1,y),y->TPDF(3,y),y->TPDF(7,y)],-4..4,color=red): |
| > | NP:=plot(y->NormalPDF(0,1,y),-4..4,color=blue): |
| > | with(plots): |
| > | display(TP,NP); |
![[Maple Plot]](images/TDist4.gif)
We see that the t- distribution pdf has a shape similar to that of the standard
normal N(0,1), but with more probability "mass" concentrated in the tails.
As the number of degrees of freedom
![]() ->
->
![]() , though, the
t-
distribution
, though, the
t-
distribution
pdf approaches a standard normal:
| > | plot([y->TPDF(100,y),y->NormalPDF(0,1,y)],-4..4); |
![[Maple Plot]](images/TDist7.gif)
| > |