![[Maple Math]](images/PS4191.gif) is continuous on (0,1/2]. But it
is continuous on (0,1/2]. But it
The function
![[Maple Math]](images/PS4191.gif) is continuous on (0,1/2]. But it
is continuous on (0,1/2]. But it
has neither a maximum nor a minimum on that interval . From
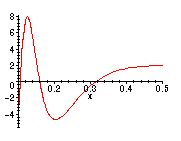
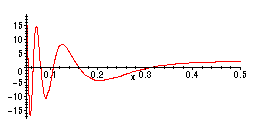
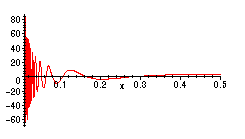
these graphs, you can see that if we consider the portion of
the graph on an interval [c,1/2] with c > 0, then
* the closer c is to zero, the bigger the maximum and
the smaller (more negative) the minimum of f(x) are, BUT
* there are still infinitely many oscillations of the function
in the interval (0,c), so the growth never stops.
N.B. Look carefully at the vertical scales on these graphs
first: c = .1
> plot(sin(1/x)/x,x=.1..0.5);

next, c = .05
> plot(sin(1/x)/x,x=.05..0.5);

Finally, c = .01:
> plot(sin(1/x)/x,x=.01..0.5);

>