MATH 241 -- Multivariable Calculus
Graphs and Contours
October 5, 2010
 

Practice visualizing contour plots and graphs of functions of
two variables.  Note that Maple does not show the contour
 

value (the "c") in contour plots.  So we have to fill that in ourselves to  

see the connection.   


> with(plots); 1
 

[animate, animate3d, animatecurve, arrow, changecoords, complexplot, complexplot3d, conformal, conformal3d, contourplot, contourplot3d, coordplot, coordplot3d, densityplot, display, dualaxisplot, fiel...
[animate, animate3d, animatecurve, arrow, changecoords, complexplot, complexplot3d, conformal, conformal3d, contourplot, contourplot3d, coordplot, coordplot3d, densityplot, display, dualaxisplot, fiel...
[animate, animate3d, animatecurve, arrow, changecoords, complexplot, complexplot3d, conformal, conformal3d, contourplot, contourplot3d, coordplot, coordplot3d, densityplot, display, dualaxisplot, fiel...
[animate, animate3d, animatecurve, arrow, changecoords, complexplot, complexplot3d, conformal, conformal3d, contourplot, contourplot3d, coordplot, coordplot3d, densityplot, display, dualaxisplot, fiel...
[animate, animate3d, animatecurve, arrow, changecoords, complexplot, complexplot3d, conformal, conformal3d, contourplot, contourplot3d, coordplot, coordplot3d, densityplot, display, dualaxisplot, fiel...
[animate, animate3d, animatecurve, arrow, changecoords, complexplot, complexplot3d, conformal, conformal3d, contourplot, contourplot3d, coordplot, coordplot3d, densityplot, display, dualaxisplot, fiel...
[animate, animate3d, animatecurve, arrow, changecoords, complexplot, complexplot3d, conformal, conformal3d, contourplot, contourplot3d, coordplot, coordplot3d, densityplot, display, dualaxisplot, fiel...
[animate, animate3d, animatecurve, arrow, changecoords, complexplot, complexplot3d, conformal, conformal3d, contourplot, contourplot3d, coordplot, coordplot3d, densityplot, display, dualaxisplot, fiel...
(1)
 

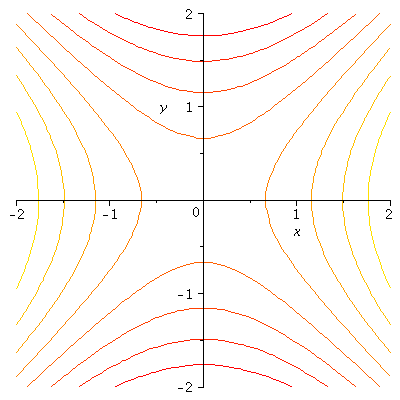
> contourplot(`+`(`*`(`^`(x, 2)), `-`(`*`(`^`(y, 2)))), x = -2 .. 2, y = -2 .. 2); 1
 

Plot_2d
 

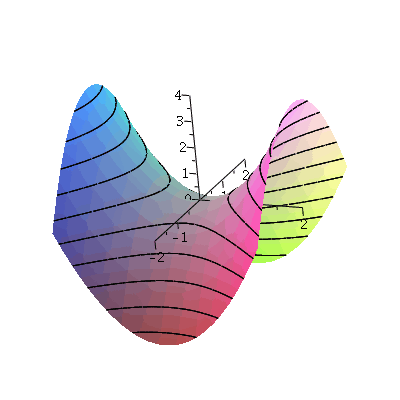
> plot3d(`+`(`*`(`^`(x, 2)), `-`(`*`(`^`(y, 2)))), x = -2 .. 2, y = -2 .. 2, style = patchcontour, axes = normal); 1
 

Plot_2d
 

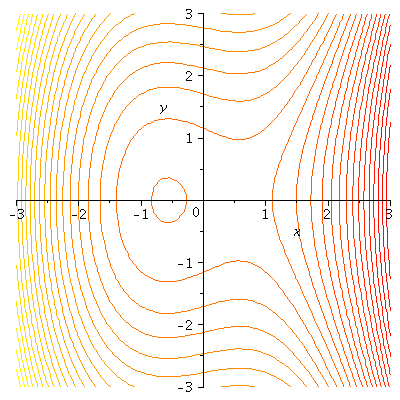
> contourplot(`+`(`*`(`^`(y, 2)), `-`(`*`(`^`(x, 3))), x), x = -3 .. 3, y = -3 .. 3, contours = 35, grid = [50, 50])
 

Plot_2d
 

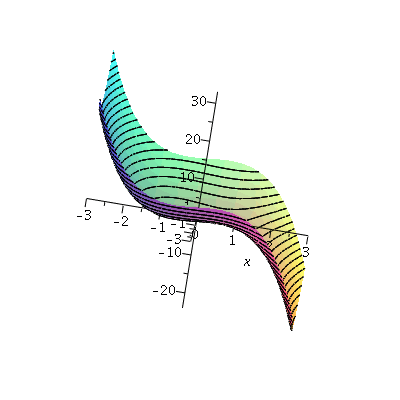
> plot3d(`+`(`*`(`^`(y, 2)), `-`(`*`(`^`(x, 3))), x), x = -3 .. 3, y = -3 .. 3, style = patchcontour, axes = normal, contours = 35)
 

Plot_2d
 

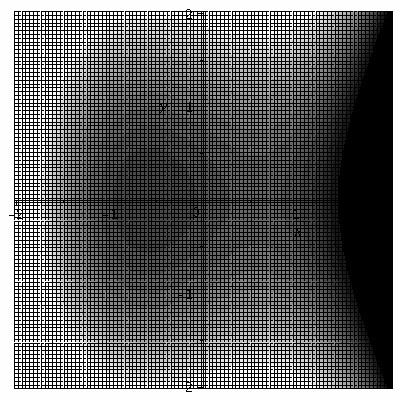
What is this graph showing?  It is called a density plot.
 

> densityplot(`+`(`*`(`^`(y, 2)), `-`(`*`(`^`(x, 3))), x), x = -2 .. 2, y = -2 .. 2, grid = [100, 100], contrast = 1, brightness = .6); 1
 

Plot_2d