MONT 108N -- Mathematics Through Time
November 17, 2010
The retrograde motion of Mars, as seen from Earth, and Ptolemy's epicycles.
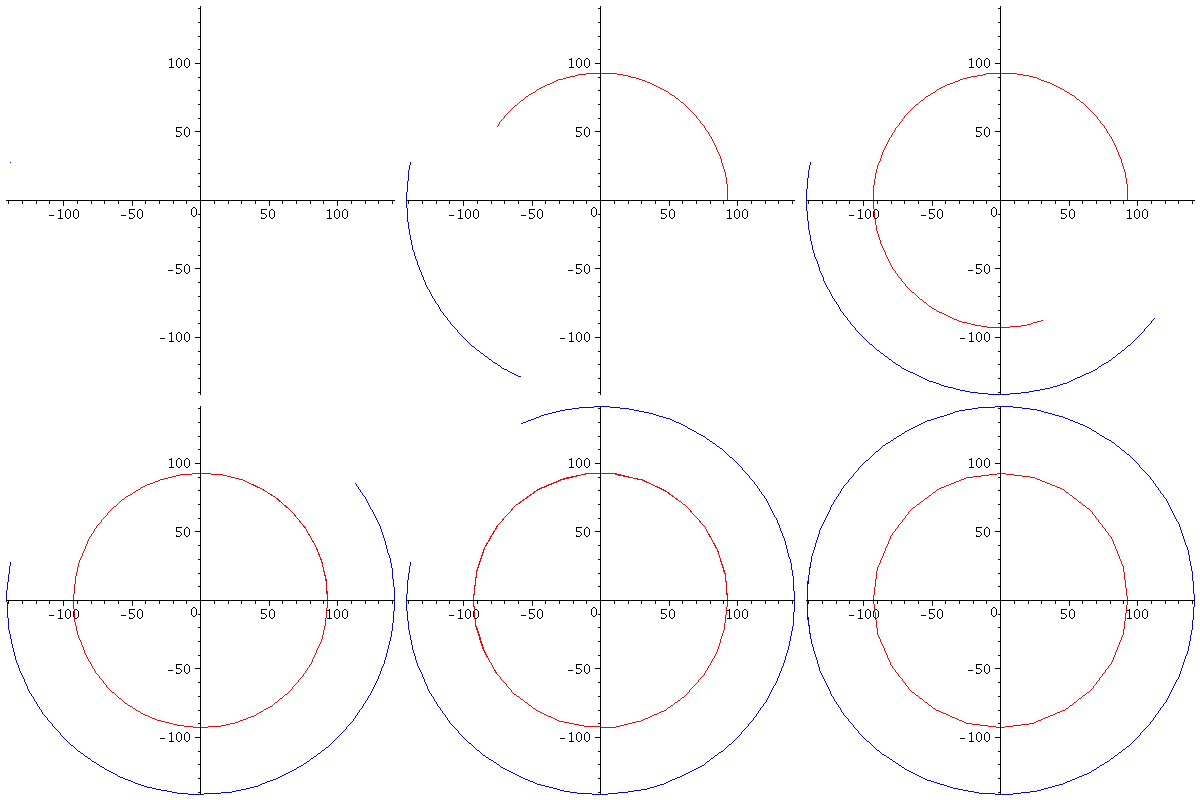
Simplifying slightly, let's assume that the Earth and Mars follow circular orbits with the Sun at the center. The radius of the Earth's orbit is roughly 92.9 million miles, and the radius of Mars's orbit is roughly 141.5 million miles. It takes the Earth roughly 365 of our days to orbit the Sun once, and the Martian year is about 686.8 Earth days. First we trace the positions of the Earth and Mars over a period of two Earth years, such that at the middle of this time interval, the Sun, Earth, and Mars are in "syzygy," meaning that the Sun, Earth and Mars are located along one straight line at that that time -- the first day of the second year:
![]()
![]()
![]()
![]()
![]()
![]()
 |
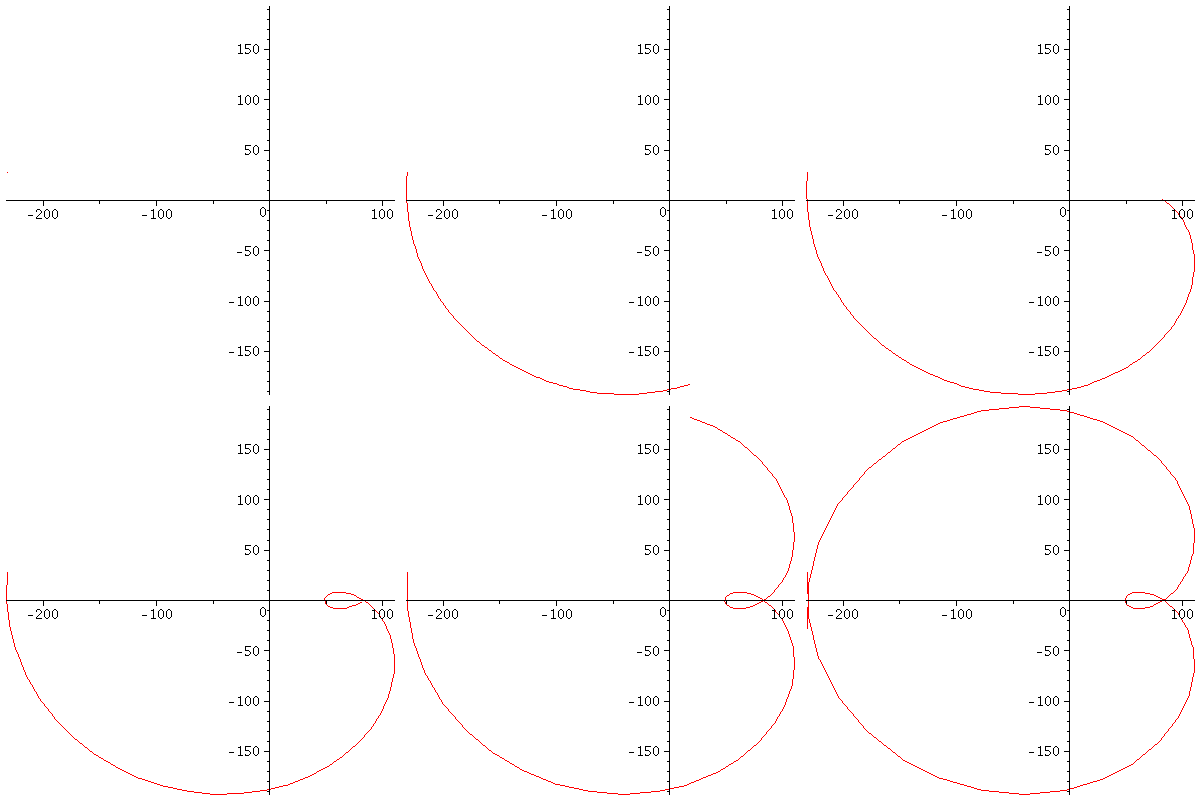
Now, let's plot the position of Mars, if viewed from the Earth (in fancy terms, this means that we introduce a new coordinate system with the Earth at the origin and plot the apparent position of Mars over the two year period):
![]()
![]()
![]()
![]()
 |
Note the way that Mars appears to move "backwards" for a time before turning and continuing in its path. This retrograde motion was very confusing to ancient astronomers. Ptolemy was one of them to come up with a reasonable mathematical description of how it should work -- essentially equivalent to the combination of sines and cosines we used to describe the relative position of Mars as viewed from Earth.
Ptolemy thought that the Earth was stationary, though, and that Mars orbited the Earth according to this complicated looping path. Of course we now know that both the Earth and Mars are orbiting the Sun (which is a part of the Milky Way galaxy which is itself moving and rotating, which is part of a group of galaxies moving with respect to each other, ... )
The point, though, was that Ptolemy came up with a mathematical description (via geometry), called a system of epicycles, that did account for the observational data that were available at the time(!)