Zipf's Law Investigations


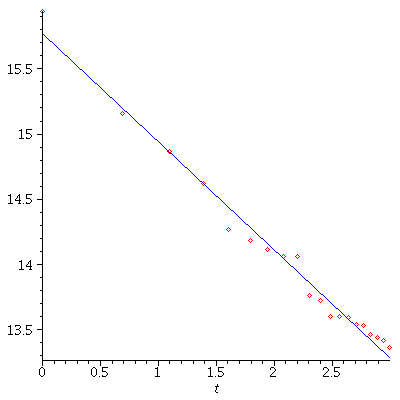
The 20 largest cities (by administrative boundaries)
`assign`(USCities, [[1, 8363710], [2, 3833995], [3, 2853114], [4, 2242193], [5, 1567924], [6, 1447395], [7, 1351305], [8, 1279910], [9, 1279329], [10, 948279], [11, 912062], [12, 808976], [13, 807815]...
 

[[1, 8363710], [2, 3833995], [3, 2853114], [4, 2242193], [5, 1567924], [6, 1447395], [7, 1351305], [8, 1279910], [9, 1279329], [10, 948279], [11, 912062], [12, 808976], [13, 807815], [14, 798382], [15...
[[1, 8363710], [2, 3833995], [3, 2853114], [4, 2242193], [5, 1567924], [6, 1447395], [7, 1351305], [8, 1279910], [9, 1279329], [10, 948279], [11, 912062], [12, 808976], [13, 807815], [14, 798382], [15...
[[1, 8363710], [2, 3833995], [3, 2853114], [4, 2242193], [5, 1567924], [6, 1447395], [7, 1351305], [8, 1279910], [9, 1279329], [10, 948279], [11, 912062], [12, 808976], [13, 807815], [14, 798382], [15...
(1)
 

plot(USCities, style = point); 1 

Plot_2d
 

`assign`(LogUS, [seq([ln(USCities[i][1]), ln(USCities[i][2])], i = 1 .. 20)]); -1 

> `assign`(PP, plot(LogUS, style = point, color = red)); 1
 

PLOT(CURVES([[0., 15.9394126665240120], [.693147180559945286, 15.1594178984658541], [1.09861228866810978, 14.8639215873363515], [1.38629436111989057, 14.6229649627629428], [1.60943791243410028, 14.265... (2)
 

with(Statistics); -1 

`assign`(LogRanks, [seq(ln(i), i = 1 .. 75)]); -1 

`assign`(LogPops, [seq(LogUS[i][2], i = 1 .. 20)]); -1 

`assign`(LSRLine, LinearFit([1, t], LogRanks, LogPops, t)); 1 

`+`(15.7702095420470947, `-`(`*`(.828856660485400965, `*`(t)))) (3)
 

> with(plots); -1
 

`assign`(LP, plot(LSRLine, t = 0 .. ln(20), color = blue)); 1 

PLOT(CURVES([[0., 15.7702095420470947], [0.652984381868310371e-1, 15.7160864966366454], [.122114260104341024, 15.6689943242193657], [.186009594031897624, 15.6160342511195704], [.250328467708701763, 15... (4)
 

display(PP, LP); 1 

Plot_2d
 

Similarly for the 20 largest cities in the UK
 

`assign`(UKPops, [7421209, 984333, 610268, 468945, 455123, 447047, 435791, 430713, 395515, 339239, 308313, 302296, 302139, 299310, 274770, 260419, 252791, 247297, 246654, 246201]); -1
 

`assign`(LogUKPops, [seq(ln(UKPops[i]), i = 1 .. 20)]); -1 

`assign`(UKLSRLine, LinearFit([1, t], LogRanks, LogUKPops, t)); 1 

`+`(14.7349756826572609, `-`(`*`(.848288810522490944, `*`(t)))) (5)
 

`assign`(UKPP, plot([seq([LogRanks[i], LogUKPops[i]], i = 1 .. 20)], style = point)); -1 

`assign`(UKLP, plot(UKLSRLine, t = 0 .. ln(20), color = blue)); -1 

display(UKPP, UKLP); 1 

Plot_2d
 

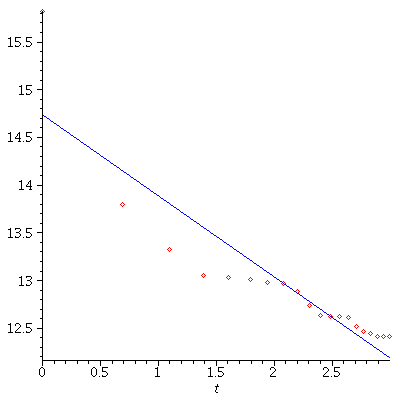
Try metropolitan areas instead ("MSAs")
`assign`(USMSAs, [19006798, 12872808, 9569624, 6300006, 5838471, 5728143, 5414772, 5376285, 5358130, 4522858, 4425110, 4281899, 4274531, 4115871, 3344813, 3229878, 3001072, 2816710, 2733761, 2667117, ...
 

nops(USMSAs); 1 

75 (6)
 

`assign`(LogUSMSAs, [seq(ln(USMSAs[i]), i = 8 .. 75)]); -1 

> `assign`(LogRanks, [seq(ln(i), i = 8 .. 75)]); -1
 

`assign`(USMSAsLine, LinearFit([1, t], LogRanks, LogUSMSAs, t)); 1 

`+`(17.7654035375854633, `-`(`*`(.997900037768796100, `*`(t)))) (7)
 

`assign`(USMSAPP, plot([seq([LogRanks[i], LogUSMSAs[i]], i = 1 .. 68)], style = point)); -1 

`assign`(USMSALP, plot(USMSAsLine, t = 0 .. ln(75), color = blue)); -1 

display(USMSAPP, USMSALP); 1 

Plot_2d
 

Get very close agreement with the suggested exponent 

-1 for the MSAs if the 7 largest are omitted.