MONT 106N -- Identifying Patterns 

Regression Example -- October 30, 2009 


The following data are the first and second exam scores from a  

HC calculus class with 34 students some time in the past (confidentiality 

concerns require that I do not say exactly when this was!)


with(Statistics); -1
 

`assign`(Exam1, `<,>`(83, 68, 67, 69, 84, 93, 87, 79, 64, 95, 70, 91, 61, 78, 84, 91, 83, 57, 90, 76, 76, 68, 96, 37, 82, 82, 81, 77, 90, 71, 84, 78, 87, 92)); 1
 

Vector[column](%id = 150462196) (1)
 

`assign`(Exam2, `<,>`(83, 82, 73, 80, 89, 96, 81, 90, 75, 95, 70, 85, 53, 74, 91, 93, 85, 60, 79, 87, 76, 78, 91, 68, 89, 76, 81, 87, 96, 76, 68, 76, 82, 94)); 1
 

Vector[column](%id = 150462324) (2)
 

The summary statistics for the two exams:`assign`(SP, ScatterPlot(Exam1, Exam2, color = blue)); -1 

`assign`(M1, Mean(Exam1)); 1 

78.55882353 (3)
 

`assign`(M2, Mean(Exam2)); 1 

81.14705882 (4)
 

`assign`(SD1, StandardDeviation(Exam1)); 1 

12.48317941 (5)
 

`assign`(SD2, StandardDeviation(Exam2)); 1 

10.18654000 (6)
 

`assign`(PP, plot([[M1, M2]], style = point, color = red)); -1 

`assign`(LP, plot(`+`(M2, `/`(`*`(SD2, `*`(`+`(x, `-`(M1)))), `*`(SD1))), x = 60 .. 100)); -1 

with(plots); -1

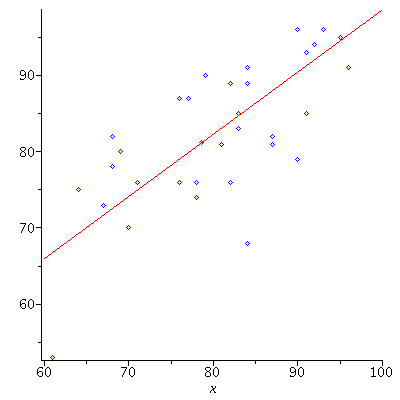
Here is the scatter plot with the first exam score for each of the 34
 

students on the x-axis and the second exam score on the y-axis  ,  

together with the SD-line:
 

display(SP, PP, LP); 1 

Plot_2d
 

`assign`(Aves, []); -1; for i from 60 to 100 do `assign`(Total, 0); `assign`(Number, 0); for j to 34 do if Exam1[j] = i then `assign`(Total, `+`(Total, Exam2[j])); `assign`(Number, `+`(Number, 1)) end...

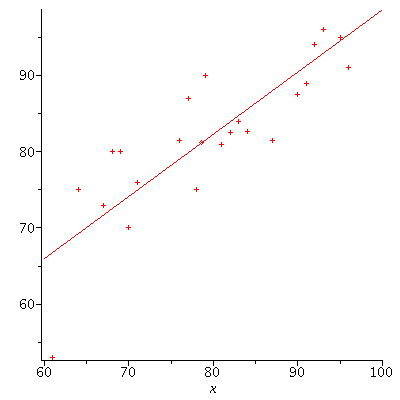
Now we plot the averages of the second exam scores
for each possible score on the first exam:  


`assign`(AP, plot(Aves, style = point, symbol = cross, color = red)); -1 

display(AP, PP, LP); 1 

Plot_2d
 

As we expect, these averages tend to lie above the SD-line if x is less 

than the average of the x's  and below the SD-line if x is greater 

than the average of the x's.  (RECALL, this comes by thinking about 

the shape of the football-like cloud and the fact that the SD-line goes 

through the tips of the football.) 


Next, we show the regression line (dashed), together with 

the SD-line and the averages of y's for each x 


`assign`(RP, plot(LinearFit([1, t], Exam1, Exam2, t), t = 60 .. 100, linestyle = dash)); -1 

display(AP, PP, LP, RP); 1 

Plot_2d
 

The slope of the regression line is related to the correlation
coefficient and the slope of the SD-line as follows:
 

`assign`(r, Correlation(Exam1, Exam2)); 1 

.7249745390 (7)
 

`/`(`*`(r, `*`(SD2)), `*`(SD1)); 1 

.5915946490 (8)
 

LinearFit([1, t], Exam1, Exam2, t); 1 

`+`(34.6720792033905170, `*`(.591594648852385774, `*`(t))) (9)