takes values in the range
MONT 105Q -- Mathematical Journeys
Geometric Meaning of the Correlation Coefficient
April 11, 2016
Given a scatter plot, the correlation coefficient r
is a way to quantify how close the points (x, y) are to
lying along a single straight line. The coefficient
takes values in the range ![]() to 1:
to 1:
A value of r = -1: indicates that the points all
lie along a line of negative slope
r = 0: indicates no linear relationship at all
r = +1: indicates that the points all
lie along a line of positive slope
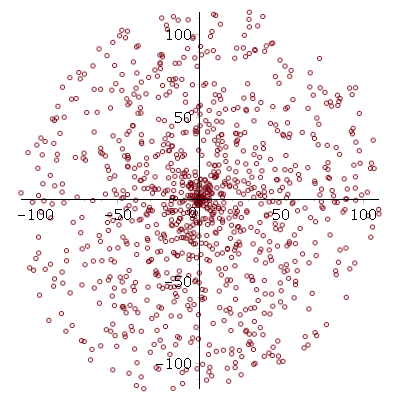
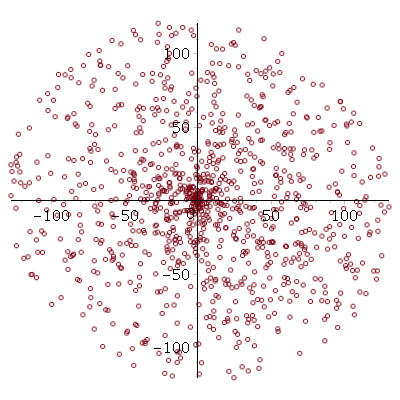
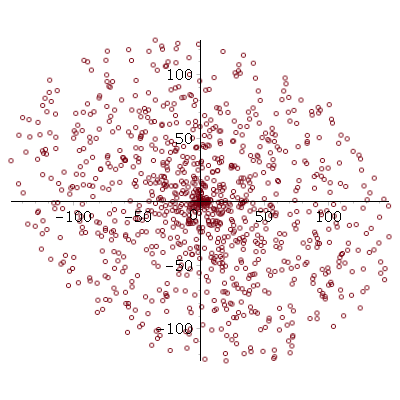
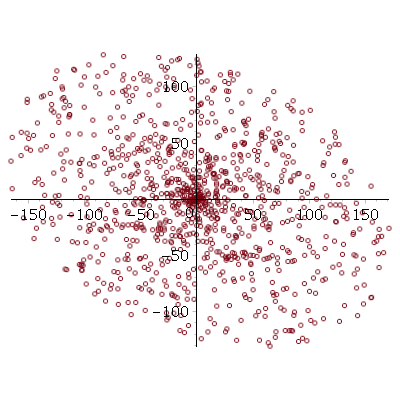
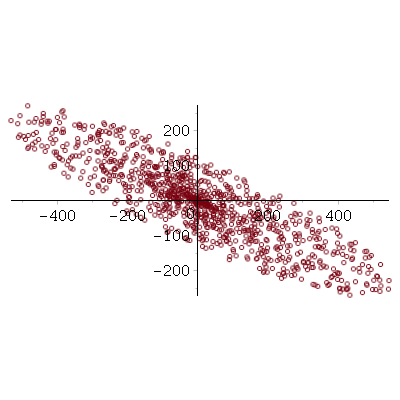
Values between 0 and 1 or between -1 and 0 indicate
the ``strength'' of the tendency toward a linear relation
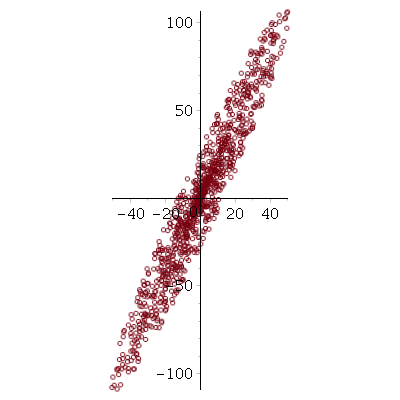
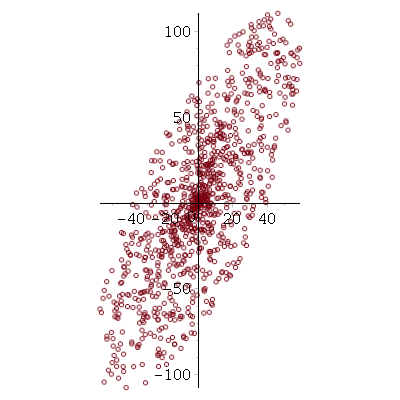
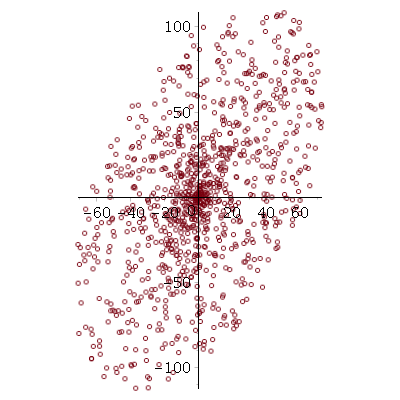
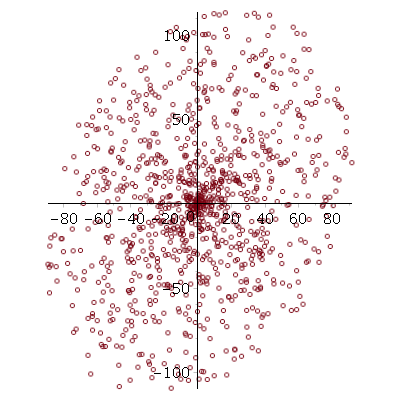
between x and y. Here are some illustrative examples:
 |
 |
 |
 |
 |
 |
 |
 |
 |