Mathematics 134 -- Intensive Calculus for Science 2
Whole Class Discussion -- A Balloon Trip with the Montgolfier Brothers, Continued
January 15, 2002
The Story
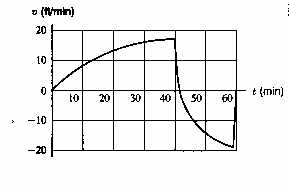
The graph below
shows the vertical velocity v of the Montgolfier
brothers' balloon as a function of time t on one trip. Recall
that we analyzed this trip in a discussion last semester and saw that
- The burner in the balloon apparently went out at t = 40
- The balloon was rising from t=0 to about t = 42,
and falling between then and t = 60
- The balloon had positive acceleration from t=0
to t = 40, and again briefly just before t = 60.
Today, we want to use the same graph of the velocity
to try to estimate the total change in height
over the trip using the information in the graph.
Discussion Questions
- What were the smallest and largest velocities
of the balloon for t between t = 0 and t = 10?
Use this information to give two estimates of the distance travelled
on this interval -- one definitely smaller than the actual distance
travelled, and one definitely larger.
- Now do the same on the intervals
t = 10 to t = 20,
t = 20 to t = 30,
t = 30 to t = 40, and
t = 40 to t = 42.
- Use the results of the previous questions to give two estimates of the
maximum altitude the balloon reaches -- one definitely an
overestimate and one definitely an underestimate. (How?)
- Now, do the same for the downward portion of the trip -- give a
definite overestimate and underestimate for
the total change in altitude over the downward part of the trip.
- Using your work on the previous questions,
did the balloon end up higher, lower, or at the same
height it started? How can you tell?