What do the probability histograms look like as
MONT 105Q -- Mathematical Journeys
Probability Histograms -- Evidence for CLT
February 5, 2010
Consider the box ![]() and make
and make ![]() draws with replacement.
draws with replacement.
What do the probability histograms look like as ![]() increases?
increases?
Here is some code (for the computer algebra system Maple we use in
many mathematics courses) in that computes the binomial probabilities
and generates the corresponding probability histograms:
| > |
| > |
| > |
| > |
| > |
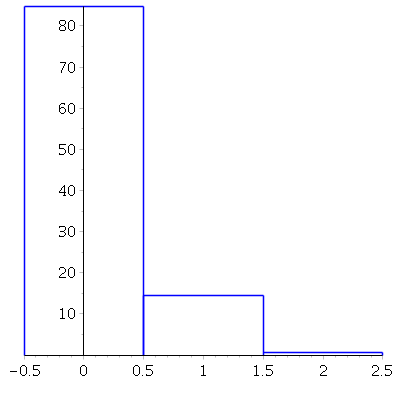
With ![]() draws:
draws:
| > |
 |
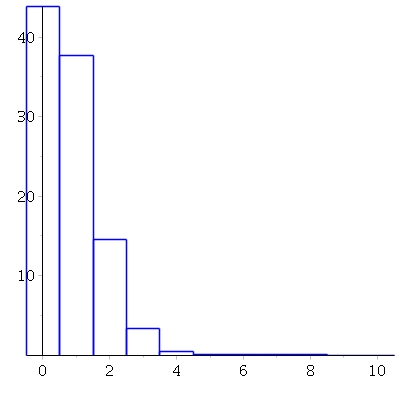
With ![]() draws:
draws:![]()
| > |
 |
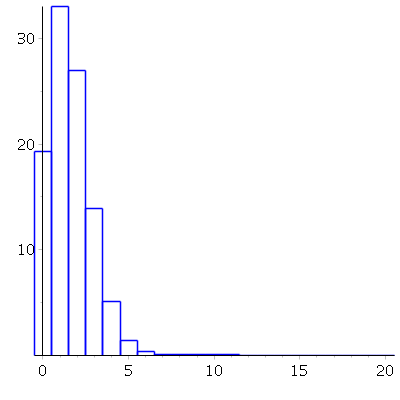
With ![]() draws:
draws:![]()
| > |
 |
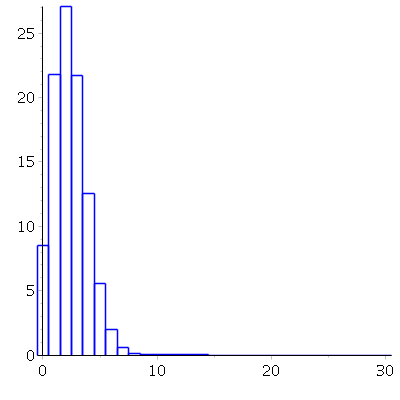
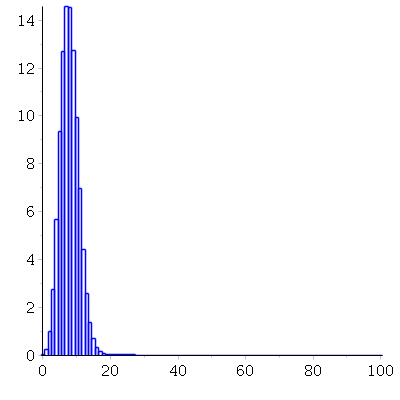
With ![]() draws (at this point, notice that
draws (at this point, notice that
the probability histogram is starting to look more "normal"
in shape(!)
| > |
 |
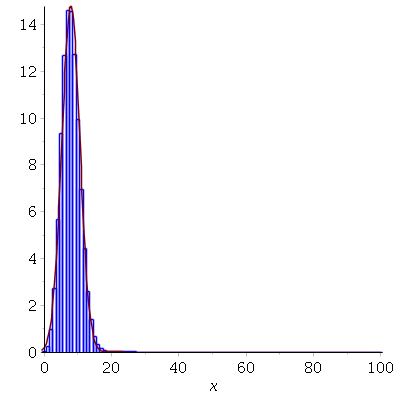
Finally, with ![]() draws, and an approximating
draws, and an approximating
normal curve in red:
| > |
 |
| > |
| > |
| > |
| > |
 |
| > |