MATH 174 -- Applied Mathematics 2
April 25, 2000
Modulation and Demodulation Techniques
We begin with a piecewise-linear, time-limited signal f with f(x) >= 0 all x:
> restart;
> f := x->piecewise(0 < x and x < 1,5*x/2,1 < x and x < 2,25/6-5*x/3,2 < x and x < 3, -5/2 + 5*x/3 ,3 < x and x < 4,10 - 5*x/2);
![]()
> plot(f(x),x=0..5,y=-1..5);
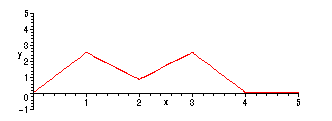
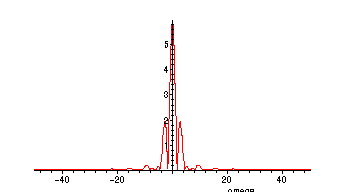
The Fourier transform of f (OK to use the analog formulas rather than FFT here since f is relatively
simple!!):
> FTRf := omega->evalf(int(f(x)*cos(omega*x),x=0..4));
![[Maple Math]](images/AmpMod3.gif)
> FTIf := omega->evalf(int(f(x)*sin(omega*x),x=0..4));
![[Maple Math]](images/AmpMod4.gif)
> FPSf := omega->sqrt(FTRf(omega)^2+FTIf(omega)^2);
![]()
> plot(FPSf(omega),omega=-50..50,numpoints=200);
>
Double Side-band (DSB) Modulation
Using DSB amplitude modulation, we would transmit the product of f and a "carrier signal"
![]() , where
, where
![]() is relatively large (ideally, we would want this so large that
is relatively large (ideally, we would want this so large that
the Fourier transform of f was zero outside [
![]() ]).
]).
Note: This is very close to zero for |
![]() | > 30, so we will take that as our carrier frequency.
| > 30, so we will take that as our carrier frequency.
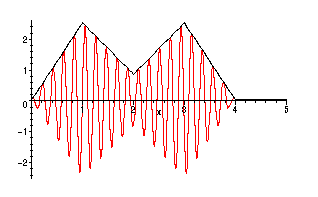
After modulation:
> g := x -> cos(30*x)*f(x);
![]()
Note that the outline of the signal f is visible in the "envelope" of the modulated signal g:
> gp:=plot(g(x),x=0..5,color=red):
> fp:=plot(f(x),x=0..5,color=black):
> with(plots): display({fp,gp});
>
Fourier Transform of the Modulated Signal
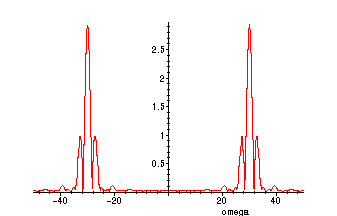
The Fourier transform of the modulated signal g consists of two shifted and scaled
copies of the transform of f, superposed on each other (i.e. added). The shifting
left and right is by the amount
![]() = 30:
= 30:
> FTRg := omega->evalf(int(g(x)*cos(omega*x),x=0..4));
![[Maple Math]](images/AmpMod14.gif)
> FTIg := omega->evalf(int(g(x)*sin(omega*x),x=0..4));
![[Maple Math]](images/AmpMod15.gif)
> FPSg := omega->sqrt(FTRg(omega)^2+FTIg(omega)^2);
![]()
> plot(FPSg(omega),omega=-50..50,numpoints=200);
>
Synchronous Demodulation
At the other end of the transmission channel, to recover the original signal, we
can use synchronous demodulation:
a) Multiply g(x) by another factor of
![]()
> h:=x -> g(x)*cos(30*x);
![]()
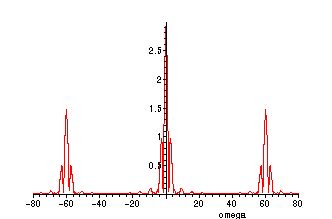
The Fourier transform of this new function h(x) now consists of three superposed copies of the
transform of f:
> FTRh := omega->evalf(int(h(x)*cos(omega*x),x=0..4));
![[Maple Math]](images/AmpMod20.gif)
> FTIh := omega->evalf(int(h(x)*sin(omega*x),x=0..4));
![[Maple Math]](images/AmpMod21.gif)
> FPSh := omega->sqrt(FTRh(omega)^2+FTIh(omega)^2);
![]()
> plot(FPSh(omega),omega=-80..80,numpoints=300);
>
Question: How can we recover f(x) from this information?
We can recover f(x) (up to a good approximation) by:
1) Putting h(x) through a low-pass filter (retaining only frequencies
in the range -30 to 30, for example)
2) Amplifying the resulting signal (multiplying by 2)
>
Quadrature Amplitude Modulation (QAM)
This is a method for increasing the amount of information that can be transmitted via
a modem and a communications channel. The idea is that two signals can be sent
simultaneously, since the above DSB approach essentially only uses real parts of the
signal and its Fourier Transform. Suppose we wanted to send the signal f(x) above,
and a second signal g(x):
> g := x -> piecewise(0<=x and x<=4, abs(cos(3.2*x)),0);
![]()
> plot({f(x),g(x)},x=-1..5);

For QAM, we transmit the signal
> send := x->cos(30*x)*f(x) - sin(30*x)*g(x):
> plot(send(x),x=-1..5);
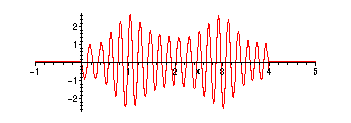
To demodulate at the other end of the transmission channel, we proceed as follows. First
we multiply by
![]() .
.
> F1:=x->cos(30*x)*send(x);
![]()
The Fourier Transform of this looks like this. (We use FFT here instead of the integral
formula for the FT):
> readlib(FFT);
![]()
> samplesR:=array([seq(evalf(F1(4*j/1024)),j=0..1023)]):
> samplesI:=array([seq(0,j=0..1023)]):
> FFT(10,samplesR,samplesI);
![]()
> FFTpoints:=[seq([2*Pi*k/4,sqrt(samplesR[k]^2+samplesI[k]^2)],k=1..200)]:
> plot(FFTpoints);

If we low-pass filter this (pass band
![]() ), and amplify, we recover f:
), and amplify, we recover f:
> filterR:=[seq(1,j=1..20),seq(0,j=21..1003),seq(1,j=1004..1024)]:
> filterI:=[seq(0,j=1..1024)]:
> FsamplesR:=array([seq(samplesR[j]*filterR[j],j=1..1024)]):
> FsamplesI:=array([seq(samplesI[j]*filterR[j],j=1..1024)]):
> iFFT(10,FsamplesR,FsamplesI);
![]()
> points:=[seq([4*j/1024,2*FsamplesR[j]],j=1..1024)]:
> plot(points);
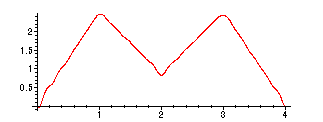
Similarly, we recover g(x) by multiplying by
![]() and proceeding as above:
and proceeding as above:
>
> F2:=x->sin(30*x)*send(x);
![]()
The Fourier Transform of this looks like this. (We use FFT here instead of the integral
formula for the FT):
> samplesR:=array([seq(evalf(F2(4*j/1024)),j=0..1023)]):
> samplesI:=array([seq(0,j=0..1023)]):
> FFT(10,samplesR,samplesI);
![]()
> FFTpoints:=[seq([2*Pi*k/4,sqrt(samplesR[k]^2+samplesI[k]^2)],k=1..200)]:
> plot(FFTpoints);

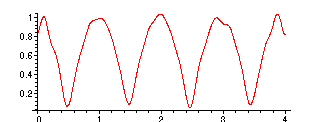
If we low-pass filter this (pass band
![]() ), and multiply by -2, we recover g (approximately)
), and multiply by -2, we recover g (approximately)
> filterR:=[seq(1,j=1..20),seq(0,j=21..1003),seq(1,j=1004..1024)]:
> filterI:=[seq(0,j=1..1024)]:
> FsamplesR:=array([seq(samplesR[j]*filterR[j],j=1..1024)]):
> FsamplesI:=array([seq(samplesI[j]*filterR[j],j=1..1024)]):
> iFFT(10,FsamplesR,FsamplesI);
![]()
> points:=[seq([4*j/1024,-2*FsamplesR[j]],j=1..1024)]:
> plot(points);
>
Frequency Modulation (FM)
Comment: The other commonly-used method for radio transmissions
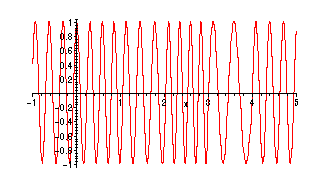
is frequency modulation (FM). A corresponding FM signal for f:
> plot(cos((20+f(x))*x),x=-1..5,numpoints=100);
>