


Next: Discussion
Up: Discussion
Previous: Discussion
Although it is not necessary to focus on a single base, for the
purposes of this discussion let us continue to work with the function
 . In each of the following questions where you are asked to
describe the behavior of a function f, describe its behavior in the
region of your plot and as x approaches both
. In each of the following questions where you are asked to
describe the behavior of a function f, describe its behavior in the
region of your plot and as x approaches both  and
and  .
.
-
- Let
 . Using what we know about
  ,
plot g and describe its behavior. Explain the behavior of g in
terms of the behavior of f.
,
plot g and describe its behavior. Explain the behavior of g in
terms of the behavior of f. - Is g a function that can be written in the form
 where k is a constant? Explain why or why not?
 - How would your plot and description change if 1 were replaced by
a constant b?
-
- Let
 . Using what we know about
  , plot g and describe its behavior. Explain the behavior of g
in terms of the behavior of f.
, plot g and describe its behavior. Explain the behavior of g
in terms of the behavior of f. - How would your plot and description change for the function
 ? Explain your answer.
 - How would your plot and description from (a) change for the
function
 ? Explain your answer.
-
- Let
 . Plot g and describe its
behavior based upon your knowledge of
. Plot g and describe its
behavior based upon your knowledge of  .
. - How would your answer change if instead we defined g by
 ?
? - How would your answer change if instead we defined g by
 ?
?
- In the first three problems, we have worked our way up to thinking about
functions that take the form
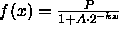 , where
P, A, and k are fixed positive numbers. Now let us apply this
to a particular example.
, where
P, A, and k are fixed positive numbers. Now let us apply this
to a particular example.
The United States experienced a polio epidemic in 1949. At the end of
January, 494 cases of polio had been reported. By the end of
December, a total of 42,375 cases had been reported. Let us assume
that the maximum number that was eventually reported was 43,000.
- Explain how would you use this information to construct a
function of the form
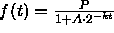 to model the
spread of the polio epidemic. That is, how would you go about finding
particular P, A, and k to fit this information. (Assume that the
time t is measured in months.)
to model the
spread of the polio epidemic. That is, how would you go about finding
particular P, A, and k to fit this information. (Assume that the
time t is measured in months.) - Carry out the calculations to find P, A, and k.
- Plot your function f for the values you have from (b) and
describe the course of the epidemic. In particular, when was the
epidemic spreading the fastest, when was it spreading the slowest?
Next: Discussion
Up: Discussion
Previous: Discussion
Thu Jul 29 16:28:25 EDT 1999