CSCI 384 Computer Graphics
College of the Holy Cross, Fall 2003
Home | | Syllabus | |
Assignments | |
Documentation
Assignment 1Due: Thursday, September 18, in class
Problem 1: Long before there were computers, there was graphic design. Painters have been studying how to make realistic pictures for thousands of years. Sometime during the Renaissance artists discovered that for objects in the distance to look realistic, they need to be smaller in size in the painting than objects nearby. Based on your knowledge of the projection system in a pinhole camera (Perspective projection), explain why this is so. Sketch a diagram that illustrates your point. Problem 2: In creating realistic objects, the viewpoint of the observer is as important as the layout of the object. Consider a wire-frame object defined by the following four 3D points (X, Y, Z): p1: (0.5, 0.5, 1)
These vertices are connected with single lines between p1 and p2, p2 and p3, p3 and p4, but not between p4 and p1. Part a: Remembering that, for perspective projection, the coordinates of projection onto an image plane are given by: y = Yd/Z
The 3D coordinates of the object are given by uppercase letters (X,Y,Z) and the 2D coordinates of the projected image are given by lowercase letters (x,y). The distance of the image plane from the center of projection is given by d.
Part b: Now suppose the observer takes a step backward (moving the projection plane and center of projection with her). The coordinates of the 4 vertices are now given by: p1: (0.5, 0.5, 2)
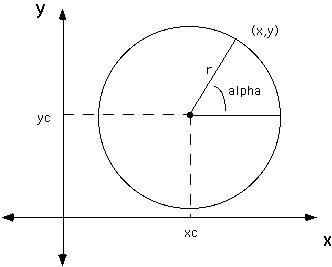
Part c: Briefly describe the differences between the two images in parts a and b. If you had been shown the two images by themselves would you have thought they originated from the same object? How does this illustrate the importance of viewpoint? Problem 3: In this problem, you will generate the coordinates for vertices around a spiral- shaped curve and use these coordinates with openGL to display a spiral. First recall how the (x, y) coordinates of evenly spaced points around a circle can be generated using polar coordinates. The radius of the circle, r, remains fixed while the angle alpha shown below increases from 0 deg to 360 deg around the circle (or equivalently, from 0 to 2*PI radians). The coordinates of the center of the circle are (xc, yc). x = xc + r * cos (alpha) y = yc + r * sin (alpha)
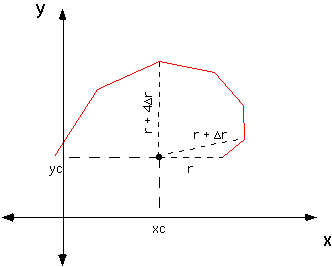
The coordinates for the vertices around a spiral figure can be created by varying the radius r as the angle alpha changes, as illustrated below:
Write an openGL program to display a spiral. Name the program file <yourUsername>_spiral.c (e.g. my program file would be croyden_spiral.c). In the display() function generate the (x,y) coordinates for successive vertices around a spiral (Hint: use a for loop). The function should have variables corresponding to the following information:
Note that the sin and cos functions in C require the angle to be specified in radians. If you give alpha and its increment in degrees, you must convert to radians by multiplying by Pi/180.0. You will have to define Pi within your program--you can define it as 3.14159.
Once you have the code drawing spirals, you can play some neat games. For example,
if you use GL_LINES as your drawing type instead of GL_LINE_STRIP, openGL will
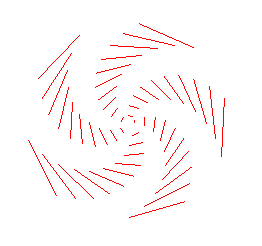
not connect every other point. Below is a spiral that was
created with 100 vertices, using GL_LINES for drawing, an initial angle alpha of 0 degrees and an
angular increment of 35 degrees, an initial radius of 10.0 and increment of r of 2.0, and center
coordinates of (0, 0) in the Viewing window. Note that I set up my viewing window
so that (0,0 ) corresponds to the center of the window. I did this in the myinit() function
with the function call:
Turning in this assignment:Turn in your written answers to problems 1 and 2 along with a hardcopy of <yourUsername>_spiral.c. Bring these to class on the due date. In addition, email a copy of your <yourUsername>_spiral.c file to me at croyden@mathcs.holycross.edu. The subject line should read "Graphics Assignment 1".
Home | | Syllabus | | Assignments | | Documentation
Constance Royden--croyden@mathcs.holycross.edu
|