MATH 376 -- Probability and Statistics II
Student's t -distributions
January 25, 2006
| > | read "/home/fac/little/public_html/ProbStat0506/MSP.map"; |
![]()
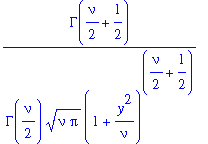
The following gives the form of the
t
-distribution pdf with
![]() degrees of freedom:
degrees of freedom:
| > | TPDF(nu,y); |
| > | TP:=plot([y->TPDF(1,y),y->TPDF(3,y),y->TPDF(7,y)],-4..4,color=red): |
| > | NP:=plot(y->NormalPDF(0,1,y),-4..4,color=blue): |
| > | with(plots): |
| > | display(TP,NP); |
![[Maple Plot]](images/TDist4.gif)
We see that the t- distribution pdf has a shape similar to that of the standard
normal N(0,1), but with more probability "mass" concentrated in the tails,
and less concentrated around the mean.
As the number of degrees of freedom
![]() ->
->
![]() , though, the
t-
distribution
, though, the
t-
distribution
pdf approaches a standard normal:
| > | plot([y->TPDF(100,y),y->NormalPDF(0,1,y)],-4..4); |
![[Maple Plot]](images/TDist7.gif)
| > |