MONT 107N -- Understanding Randomness 

Probability Histograms 


February 5, 2010 


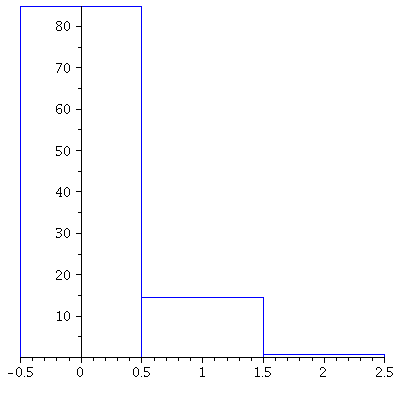
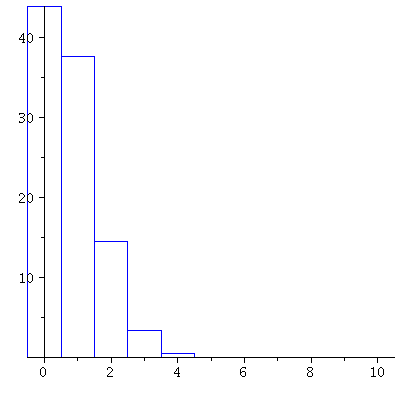
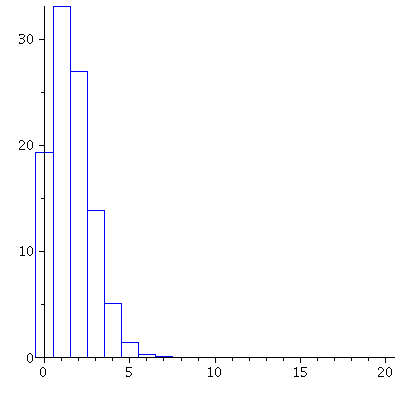
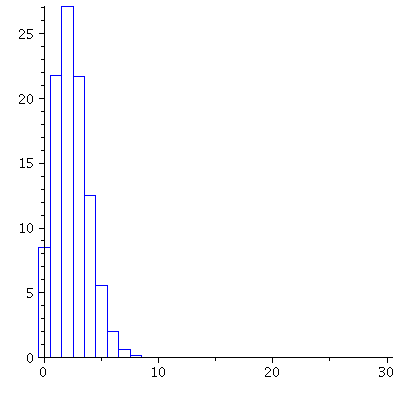
Consider the box  and make  ndraws with replacement.  
What do the probability histograms look like as  nincreases?  


Here is some Maple code that computes the binomial probabilities 

and generates the corresponding probability histograms: 


>
 

> `assign`(Y, proc (n) options operator, arrow; [seq(`*`(binomial(n, i), `*`(`^`(`/`(3, 38), i), `*`(`^`(`/`(35, 38), `+`(n, `-`(i)))))), i = 0 .. n)] end proc); -1
 

> `assign`(X, proc (n) options operator, arrow; [seq(i, i = 0 .. n)] end proc); -1
 

> `assign`(PH, proc (Xlist, Ylist) local i, start, n, pl; with(plots); `assign`(n, nops(Xlist)); `assign`(start, `+`(Xlist[1], `-`(.5))); `assign`(pl, {}); for i to `+`(n, `-`(1)) do `assign`(pl, `union...
`assign`(PH, proc (Xlist, Ylist) local i, start, n, pl; with(plots); `assign`(n, nops(Xlist)); `assign`(start, `+`(Xlist[1], `-`(.5))); `assign`(pl, {}); for i to `+`(n, `-`(1)) do `assign`(pl, `union...
 

>


With  n = 2draws: 


> PH(X(2), Y(2)); 1
 

Plot_2d


With  n = 10draws: 

> PH(X(10), Y(10)); 1
 

Plot_2d


With  n = 20draws: 

> PH(X(20), Y(20)); 1
 

Plot_2d


With  n = 30draws  (at this point, notice that
the probability histogram is starting to look more "normal"
in shape(!)
 

> PH(X(30), Y(30)); 1
 

Plot_2d


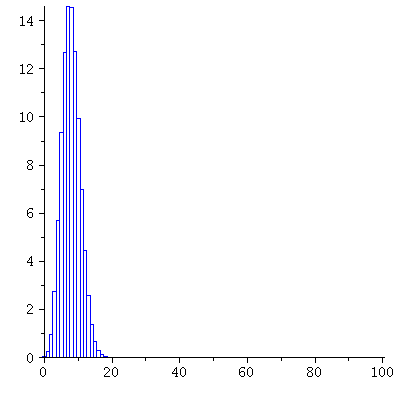
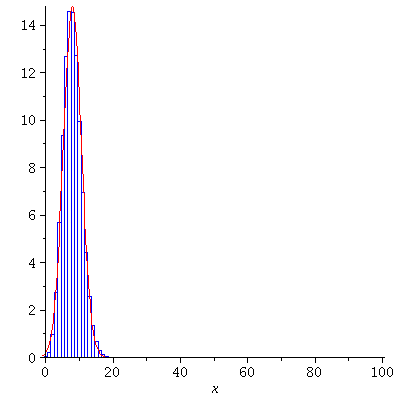
Finally, with  n = 100draws, and an approximating
normal curve in red:
 

> PH(X(100), Y(100)); 1
 

Plot_2d
 

> `assign`(sigma, `*`(sqrt(100), `*`(sqrt(`*`(`/`(3, 38), `/`(35, 38)))))); -1; `assign`(mu, `+`(`*`(`/`(1, 38), `*`(`*`(100, 3))))); -1
 

> `assign`(A, PH(X(100), Y(100))); -1
 

> `assign`(B, plot(`+`(`/`(`*`(100, `*`(exp(`+`(`-`(`*`(`^`(`+`(x, `-`(mu)), 2), `*`(`/`(`+`(`*`(2, `*`(`^`(sigma, 2)))))))))))), `*`(sqrt(`+`(`*`(2, `*`(Pi, `*`(`^`(sigma, 2))))))))), x = -1 .. 100)); ...
 

> display(A, B); 1
 

Plot_2d
 

>